 BAM GeoPortal
Common Redpoll
Type of resources
Topics
Keywords
Contact for the resource
Provided by
Formats
Representation types
Update frequencies
status
Scale
Regions
Categories
-
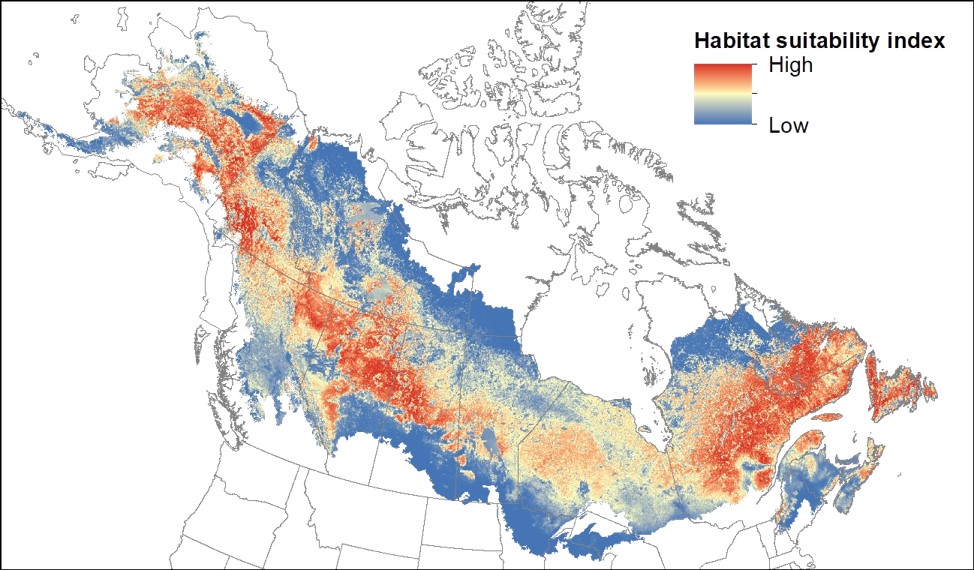
Maps depict model-predicted species distribution and provide information about relative habitat suitability based on current climate and landcover. The suitability ranking of any mapped grid cell is the sum of the probabilities of that grid cell and all other grid cells with equal or lower probability, multiplied by 100 to give a percentage. This value represents the % of grid cells with a lower suitability value within the boreal/hemiboreal study region. Higher value pixels represent higher habitat suitability for a given species.
-

Species specific mean projections and uncertainty estimates (coefficient of variation) of80 boreal-breeding songbird species generated using boosted regression tree models for the current period (based on climate data from 1961-1990) and three future time periods (2011–2040, 2041–2070, 2071–2100).